Your shop's vital signs,
now they explain themselves.
Every job flows in from your estimating software — then an AI reads across all of it and tells you, in plain English, exactly where the week needs you. No dashboards to dig through, no exports.
The numbers you read on Monday morning.
Five colour-coded tiles across the levers that move a repair shop's week. Green is fine, amber is worth a look, red is where you start.
Sales
Weekly revenue against target — by shop and across the whole group.
Parts margin
Whether the markup on parts is holding, or quietly thinning out across the work.
Repair cost
Where parts, materials, sublets and labour start to pull job margin down.
Return on people
Productivity by person and role, against the 2:1 billed-to-cost target.
Insurers
Which insurers bring healthy revenue and which ones quietly drag margin.
Stop reading dashboards. Start asking.
Monday's read is already written.
Pulse writes the week up in plain English the moment the numbers land — one story per shop, with five colour-coded tiles underneath. You walk in to what moved, and why.
- One plain-English summary per shop you run
- Written automatically once the week closes
- Tiles ranked worst-first, so you see where to start

Every red tile already explains itself.
Right under the five KPIs, each signal opens into the why — automatically. The moment one turns red, Pulse names the cause: the number, where it's heading, and exactly who or what is behind it. No clicks, no digging.
- Sits directly below the five KPI tiles
- Spots the red signal and explains what's driving it
- The number, the trend, and who or what is behind it

Then go deeper — just ask, in plain English.
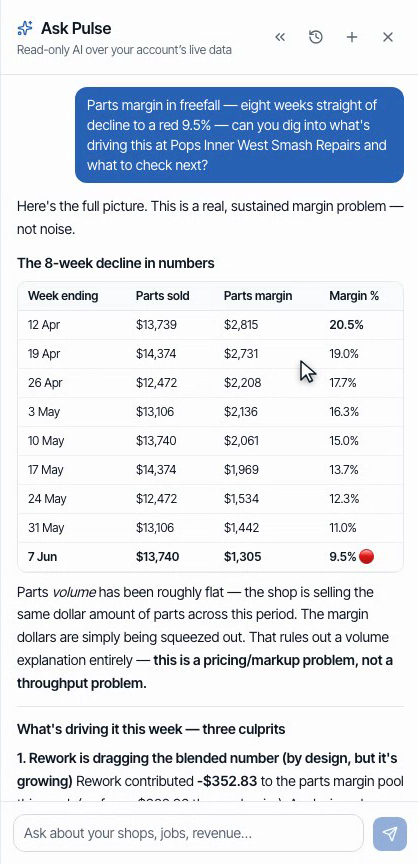
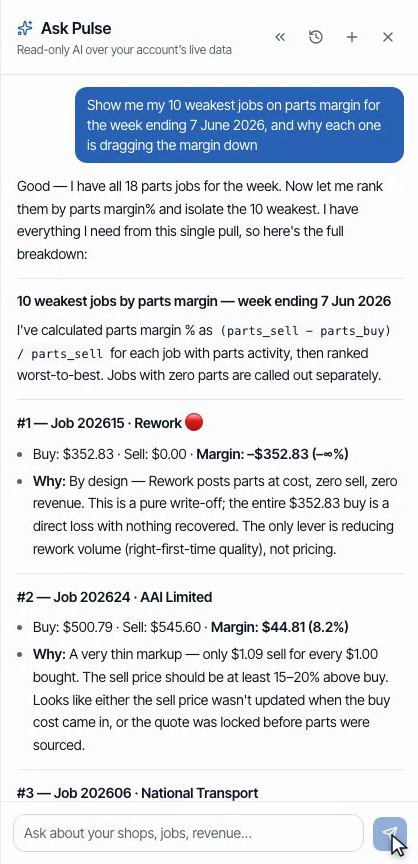
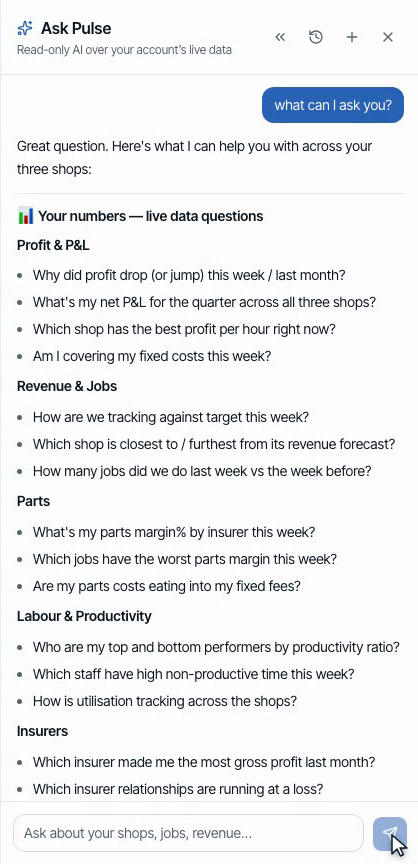
Every card comes with a question ready to go, or type your own. Pulse reads job by job through your live data, shows its full working, and only ever reads — it never changes a number. Tap a question to see the real answer it gives.
Four minutes, your numbers, real questions.
A full walkthrough — the weekly story, the five signals, and Ask Pulse reasoning through real jobs to a Monday-morning plan.
60+ visual stats, from your real numbers.
Every answer Pulse gives is grounded in live data you can see for yourself — sixty-plus visual views, pulled straight from your estimating software and your database.
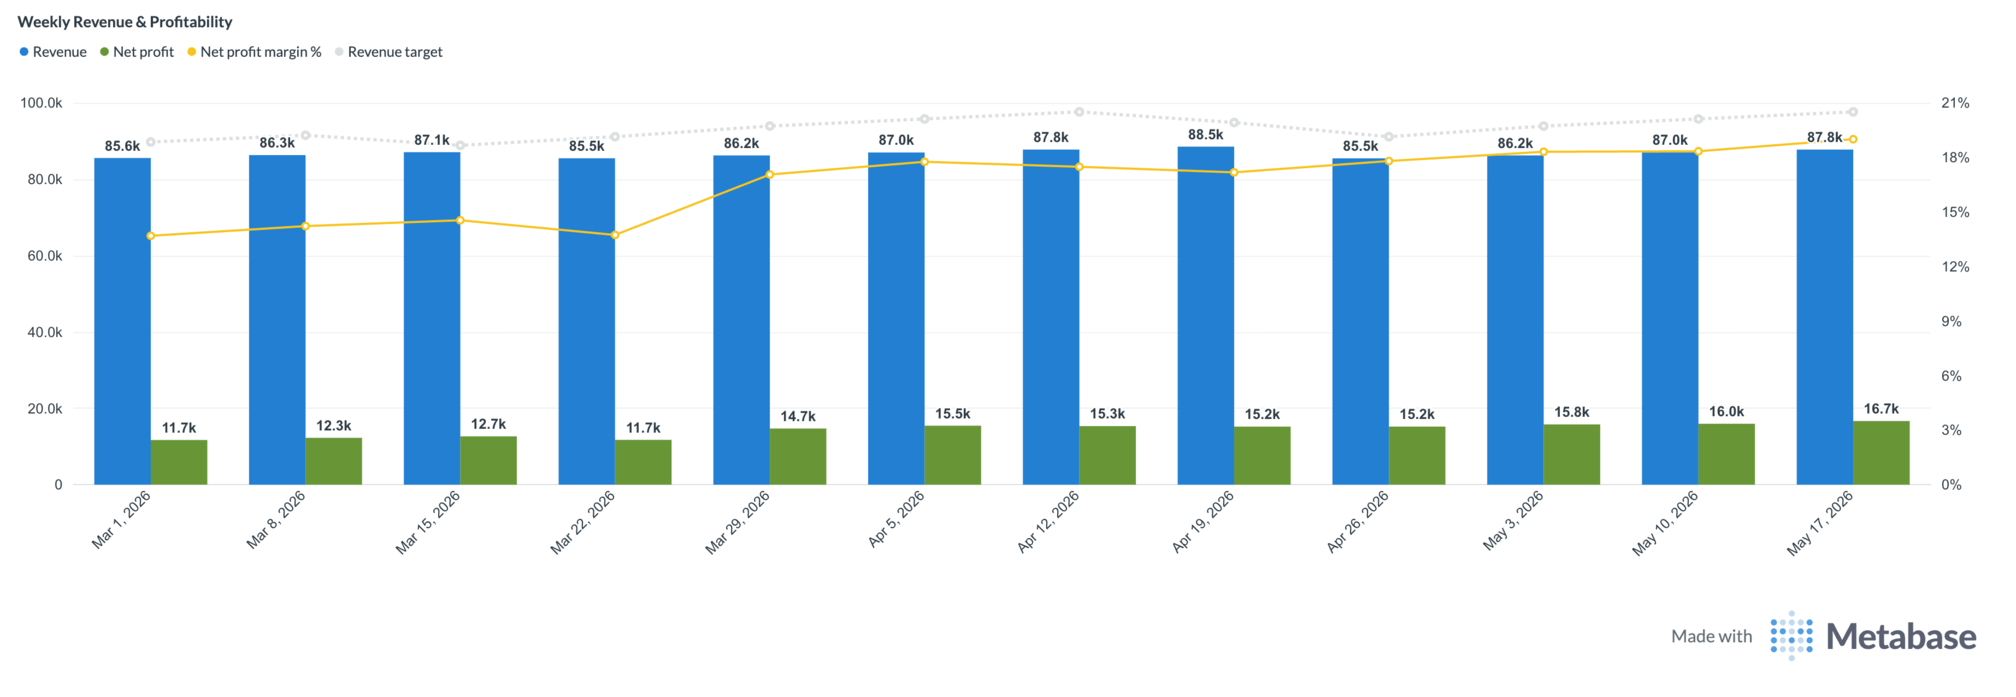
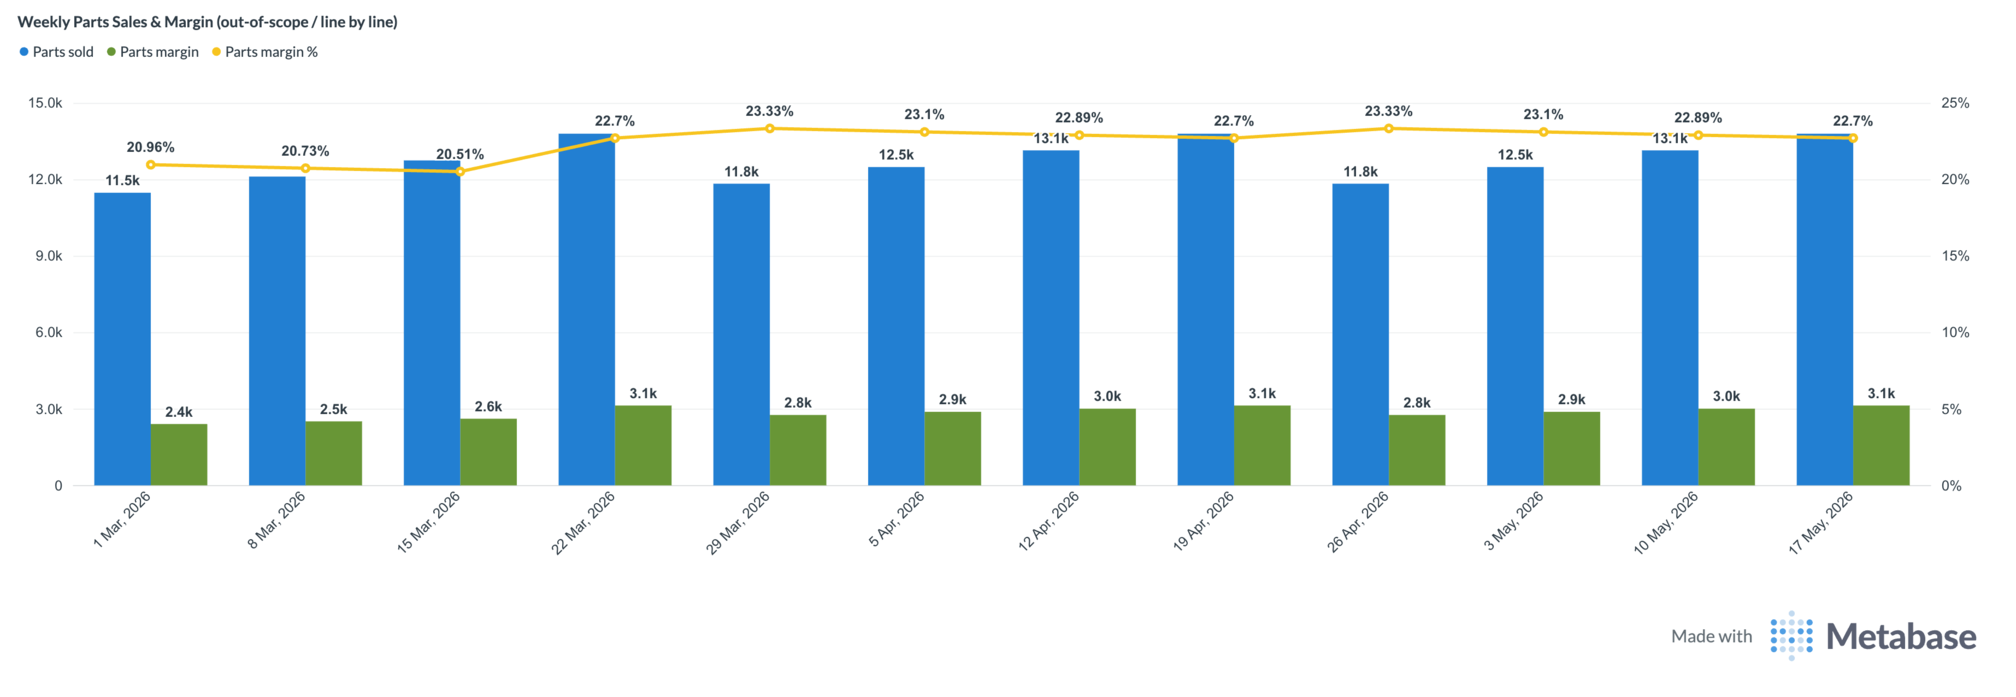
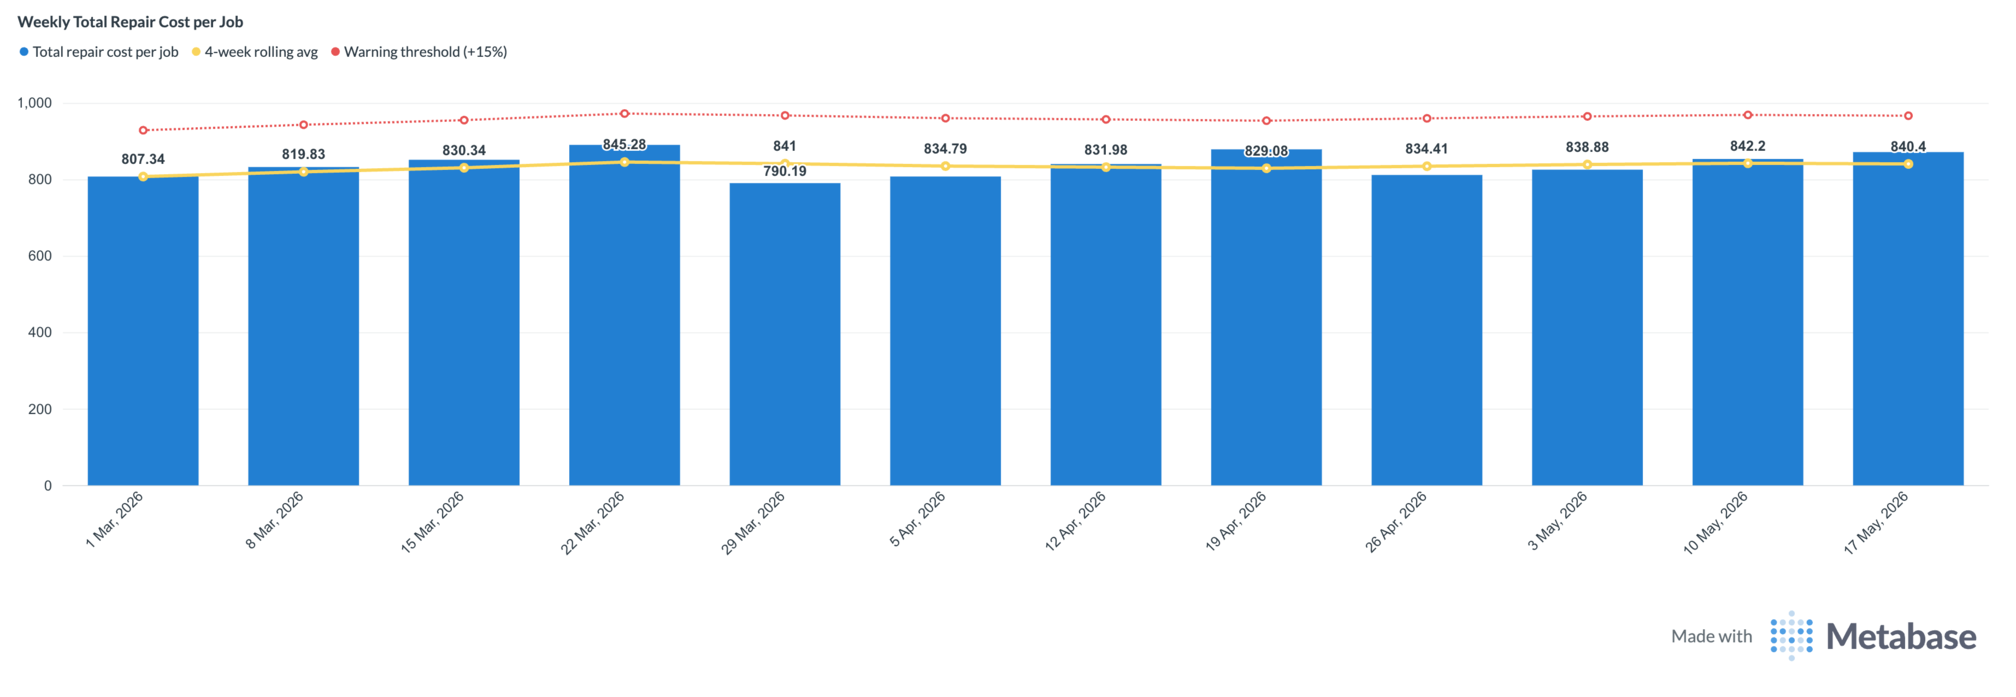
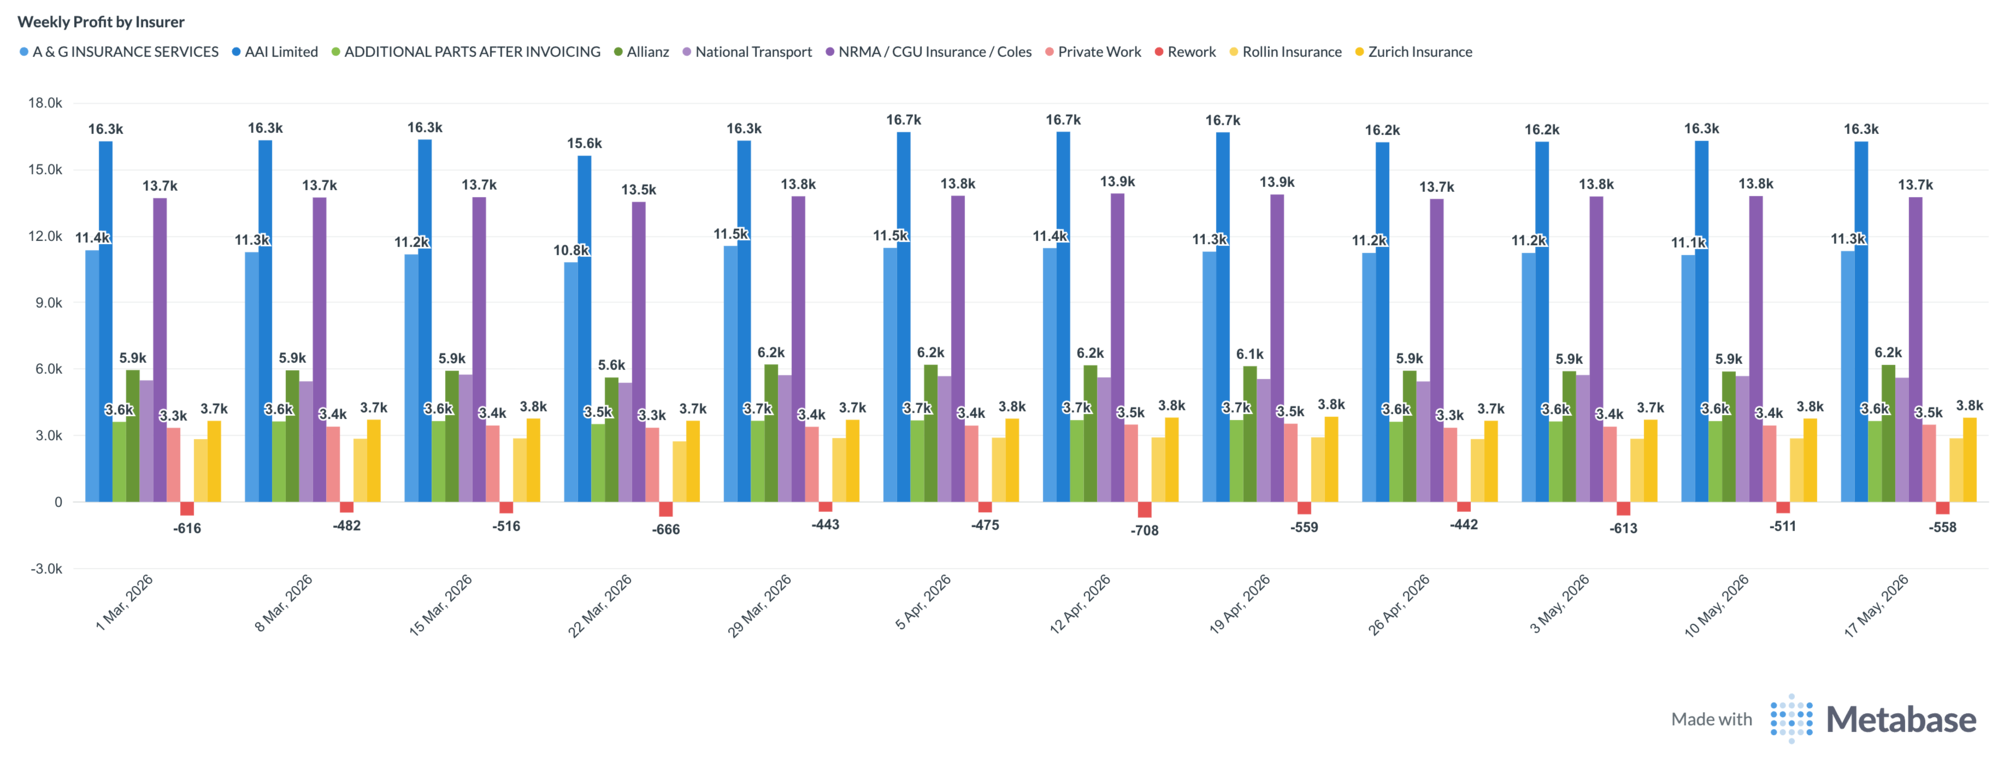
Five of 60+ live views — revenue, parts, repair cost, insurers, and the live ROI on people view, all from your own numbers.
Tap chart to zoom · tap outside to close
Automated where it should be. Editable where it has to be.
Workshop data stays on an Australian-hosted path. Invitation-only access. The reporting model follows collision repair economics — not a generic dashboard template.
Run it on your own shop's data for 30 days.
If it doesn't change your Monday morning, walk away. No upfront cost, zero commitment.
Full platform · no credit card · cancel anytimeSee it in the context of your shop.
A short read-through of the full platform — from the weekly pulse to jobs, inputs, rules and the final P&L — framed around the way your business actually runs.
- One connected operating environment, not a bundle of reports
- 80+ views across profit, labour, insurers, parts and payouts
- Built and hosted in Australia for insurer-funded collision repair
Prefer email? Reach us directly at hello@pulsebodyshop.com.